Stormglass
Environmental health signals, turned into flare-risk forecasting.
Stormglass is a real-time environmental health tracker built for people with chronic illness. It correlates barometric pressure, air quality, geomagnetic activity, and pollen with symptom patterns to help forecast flare risk for conditions like ME/CFS, POTS, and migraines.
The UI and feature set were inspired by a very outdated weather website I used for years to watch pressure graphs and anticipate bad symptom days — Stormglass modernizes that idea and expands it beyond pressure alone.

Pressure Dynamics
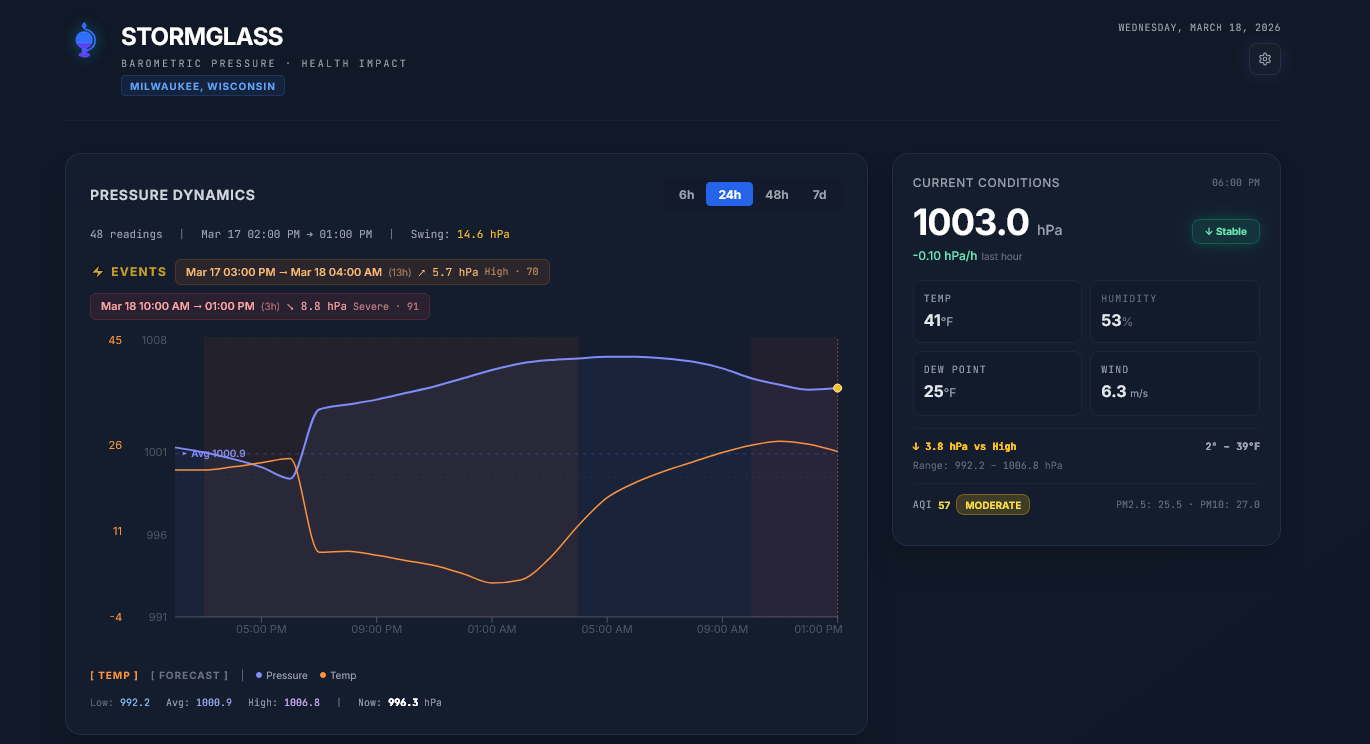
The main chart plots barometric pressure readings over selectable time windows (6h, 24h, 48h, 7d) with a toggleable temperature overlay and forecast line. It calculates swing magnitude, rate-of-change, and detects weather front passages — tagging them as events with severity ratings directly on the chart.
Health Impact Forecast
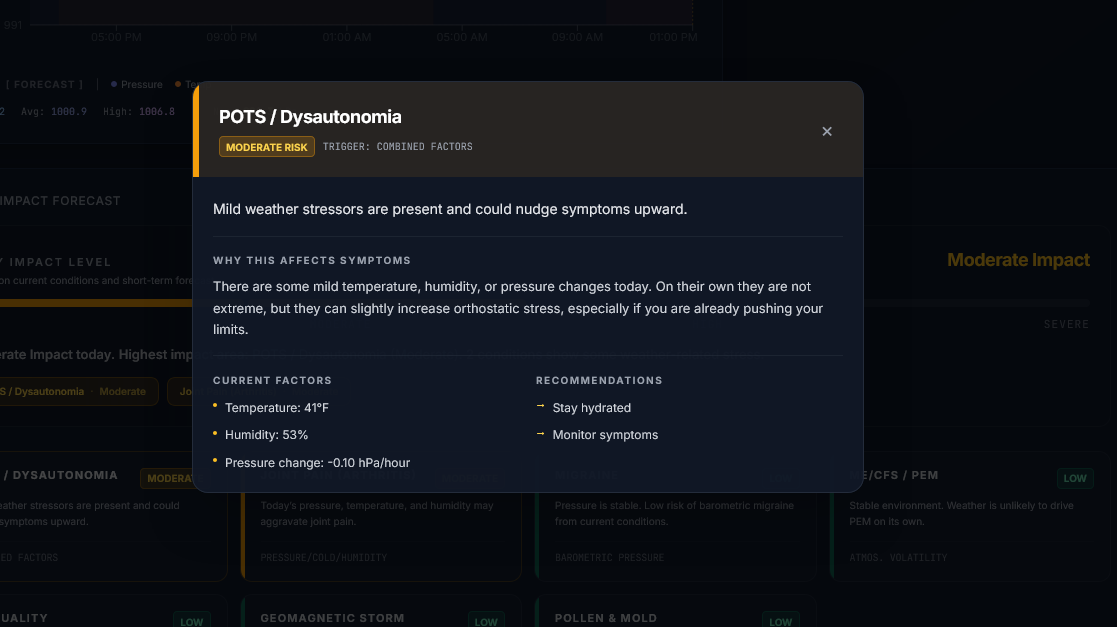
Evaluates 7 health conditions against current environmental data: POTS/Dysautonomia, Joint Pain, Migraine, ME/CFS/PEM, Air Quality, Geomagnetic Storms, and Pollen & Mold. Each condition gets a Low/Moderate/High/Severe risk level with a plain-language explanation of which factors are driving it. A composite “Body Impact Level” bar summarizes overall flare risk at a glance.
Current Conditions
A live snapshot showing pressure (with trend badge and hourly rate-of-change), temperature, humidity, dew point, wind speed, 24-hour pressure range vs. historic high, and US AQI with PM2.5/PM10 breakdowns.
Data Pipeline
A Fastify backend polls Open-Meteo (pressure, temp, humidity, wind, UV, AQI), NOAA Space Weather (Kp index, solar wind), and Tomorrow.io (pollen) on a 30-minute cron. Readings are stored in PostgreSQL via Drizzle ORM. All data sources are free — no paid weather APIs, no cloud lock-in.
Settings & Personalization
Users pick their location via geocoding search and toggle which health conditions to track. The app is installable as a PWA with offline support via Workbox for fast, app-like access on mobile.
Screenshots
Pressure Dynamics & Current Conditions
Dashboard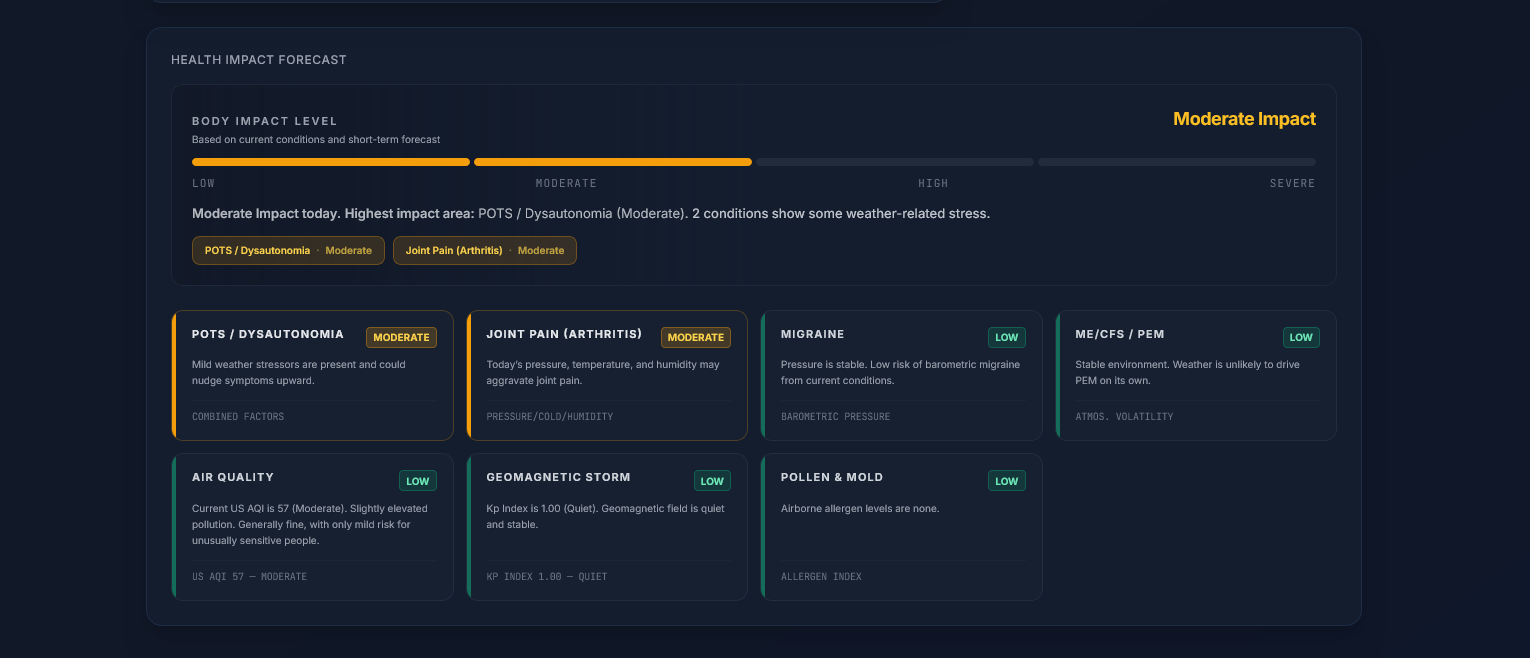
Health Impact Forecast
Condition Cards